Using YouTube Analytics to Identify Sponsorship Opportunities

The Data You Already Have
Most creators looking for sponsorships spend their energy on outreach: cold emails, pitch decks, agency sign-ups. That effort matters, but it often skips a step that makes every other part of the process easier. Before you pitch anyone, your YouTube Analytics dashboard already contains the information sponsors actually care about - and knowing how to read it changes how you position yourself, who you approach, and what you charge.
This is not about gaming the system or inflating numbers. It is about understanding what your channel data says from a brand's perspective, and using that to find the right partnerships rather than just any partnership.
What Sponsors Are Actually Buying
Sponsors do not buy views. They buy access to a specific audience. That distinction matters because it shifts the entire conversation away from subscriber counts and toward the audience profile your analytics can describe in detail.
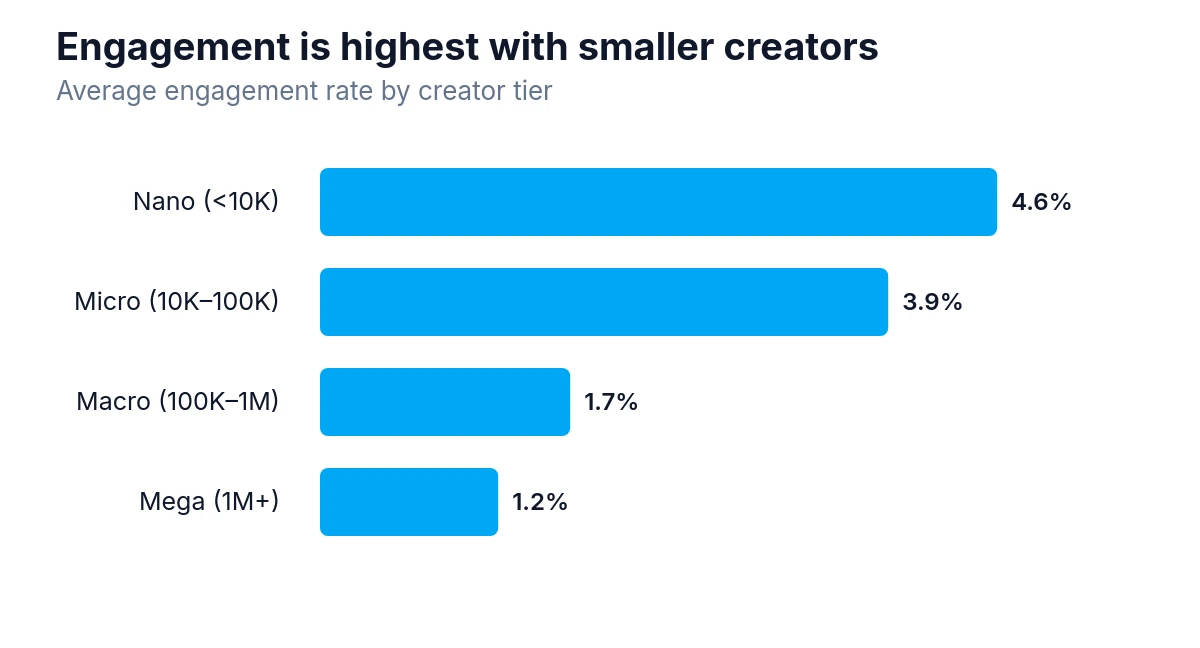
Engagement falls as creators get bigger: nano creators (under 10,000) average 4.6% engagement, while creators with over 1 million average about 1.21%.
A brand selling project management software to small business owners cares very little whether your channel has 50,000 or 500,000 subscribers. What they care about is whether your viewers include decision-makers at small companies, whether those viewers are in markets where the software is available, and whether they actually watch long enough to hear a mid-roll read.
Your analytics can answer all three of those questions. Most creators never think to look.
Demographics: The Foundation of Every Pitch
The Demographics section in YouTube Studio shows age ranges, gender distribution, and geographic breakdown of your viewers. This is the first place to spend time before approaching any sponsor.
Look at your top five countries. If your audience is heavily concentrated in the United States, Canada, the United Kingdom, or Australia, that is worth highlighting explicitly in any pitch. Creator rates by audience location can run 30-100% higher when the audience skews toward those markets, because purchasing power is higher and ad infrastructure is more developed. A channel with 30,000 subscribers but 80% US-based viewers is often more attractive to a sponsor than one with 200,000 subscribers spread thinly across dozens of countries.
Age distribution tells a different story. A channel where the majority of viewers fall between 25 and 44 is positioned well for financial products, software subscriptions, home goods, and career-related tools. A channel skewing younger, say 18 to 24, fits better with gaming peripherals, energy drinks, or fashion. Neither is better in absolute terms, but knowing which you have lets you approach the right categories instead of wasting time pitching brands whose customer profile does not match your audience.
Gender split matters less than it used to, and many sponsors care more about interest alignment than demographic boxes. Still, if your channel skews strongly in one direction, that is useful context for brands whose products are gender-specific.
Watch Time and Retention: Proving Your Audience Actually Listens
Subscriber count is the vanity metric sponsors have learned to distrust. Watch time and audience retention are what serious brand managers look at next.
Pull your average view duration and compare it to your average video length. A channel posting 15-minute videos where viewers stay for 11 minutes is demonstrating something valuable: people trust this creator enough to keep watching. That trust transfers to sponsorship reads.
The audience retention graph inside individual video analytics shows you exactly where viewers drop off. If you typically place sponsor reads at the two-minute mark and your retention curve shows a cliff at 1:45, that is a problem worth fixing before you pitch anyone. If retention holds steady through your typical ad placement zone, that is a selling point. Industry research on audience retention percentages puts average completion in the 35-60% range, with above-average channels reaching 60-70%, so knowing where your videos land gives you a concrete benchmark to cite.
Average view duration also helps you calculate something sponsors sometimes ask for: estimated impressions on a sponsorship read. If you get 50,000 views per video but only 40% of viewers reach the three-minute mark where you place your read, your effective reach for that placement is closer to 20,000. Being honest about this, and showing you understand it, builds credibility with brand managers who have been burned by inflated promises.
Traffic Sources: Understanding How People Find You
The Traffic Sources report shows where your views come from: YouTube search, suggested videos, external sites, direct links, and so on.
A channel that gets a large share of its views from YouTube search is telling you something important. Those viewers are actively looking for content in your niche. They arrived with intent. That is a different audience quality than passive viewers who stumbled onto a video through the suggested feed.
Search-driven traffic also suggests your content has a longer shelf life. A tutorial or review that ranks in YouTube search keeps accumulating views for months or years. Research tracking the lifecycle of YouTube videos found that average annual views per YouTube video run to around 36,100 across a dataset of over 170,000 videos, which means older content keeps delivering real numbers long after upload. Sponsors whose products have evergreen relevance, software tools, educational platforms, financial services, often prefer channels where older videos still drive traffic because their placement continues working after the initial upload.
If you have a significant share of external traffic, look at where it comes from. A Reddit community, a specific blog, or a podcast that regularly links to your videos tells you something about a secondary audience you might not have considered. That information can be useful when pitching brands that are already active in those communities.
Finding the Right Sponsor Category
Once you have a clear picture of your audience, the next step is matching that picture to product categories, not individual brands.
Start with your niche, but do not stop there. A cooking channel might seem like an obvious fit for kitchen equipment, but the demographics might point elsewhere. If the audience skews toward young professionals in urban areas, meal kit services, wine subscriptions, or even productivity apps used during meal prep might be a better fit. The analytics tell you who is watching; your job is to think about what else that person buys.
Look at the "Other channels your audience watches" section under the Audience tab. This is underused. If your viewers also watch channels that are already running sponsorships from specific brands, that is a signal. Those brands are actively spending in your category, they have already decided your type of viewer is worth reaching, and they have a budget allocated for creator partnerships.
You can also use your CPM data, if you have monetization enabled, as a rough proxy for audience value. CPM (cost per thousand impressions) reflects what advertisers are willing to pay to reach your viewers through YouTube's ad system. A high CPM suggests your audience is in a category that advertisers value. Personal-finance YouTube CPMs, for instance, have been reported at $20-$27 per 1,000 views against a typical creator's roughly $5, and direct sponsors in that niche will pay well to reach that audience, often at rates that exceed what YouTube's ad system pays.
Building a Pitch Around Your Data
A sponsorship pitch that leads with subscriber count is a pitch that sounds like everyone else's. One that leads with specific audience data is harder to ignore.
Structure your pitch around three things your analytics can prove:
First, describe your audience specifically. Not "my audience is interested in personal finance" but "my viewers are primarily 28 to 42 years old, based in the US and UK, with a high concentration in major metropolitan areas." If you have survey data or comment patterns that add color, include those too, but the analytics are your foundation.
Second, show your engagement quality. Average view duration, typical retention through your sponsorship placement zone, and comment volume relative to views all signal that your audience is active rather than passive. Research into creator selection criteria shows brands bet on a creator's format, audience, and storytelling logic, not just their subscriber count, and smaller creators in particular have been found to generate higher engagement rates than larger ones. A channel where viewers regularly comment, ask follow-up questions, and return for new uploads has built something that matters to sponsors: a community with a relationship to the creator.
Third, give them a realistic reach estimate. Be specific about where you place reads, what percentage of viewers typically reach that point, and what your average views per video look like over the first 30 days versus the full lifetime of a video. Sponsors appreciate honesty here because it is rare.
On pricing: rates for creator sponsorships vary enormously based on niche, audience quality, placement type, and the brand's budget. There is no universal formula, but creators typically consider their average views per video, the depth of the integration (a brief mention versus a dedicated segment), and what comparable channels in their niche charge. Looking at what brands pay through YouTube's own ad system in your category gives you a floor, since direct sponsorships almost always command a premium over programmatic ad rates.
Using Analytics Ongoing, Not Just at Pitch Time
The most useful thing about YouTube Analytics for sponsorship purposes is not the snapshot it gives you today. It is the trend data it accumulates over time.
Watch how your demographic profile shifts as your channel grows. A channel that started with a younger audience and has been gradually attracting older, higher-income viewers is a channel whose sponsorship value is increasing faster than its subscriber count suggests. That trend is worth tracking and worth mentioning to sponsors.
Pay attention to which videos over-perform with specific segments of your audience. If a particular topic drives unusually high watch time or brings in viewers from a new geography, that is a signal about where your channel might grow next, and which sponsor categories might become relevant that were not before.
After running a sponsorship, use your analytics to assess its impact. Did the video perform differently in terms of click-through rate or watch time? Did you see a spike in subscribers from a demographic that matches the sponsor's target customer? Brands that run multiple campaigns with the same creator want to see this kind of post-campaign data. Providing it without being asked sets you apart from creators who treat sponsorships as one-off transactions.
Turning Data Into Relationships
Sponsorships that work well for both sides tend to come from genuine alignment between a creator's audience and a brand's customer. Analytics help you find that alignment before you pitch, which means less time chasing the wrong brands and more time building relationships with the right ones.
The creators who build lasting sponsor relationships are not necessarily the ones with the biggest channels. They are the ones who understand their audience well enough to advocate for it honestly, who can explain why their viewers are the right fit for a specific product, and who treat the data as a tool for finding mutual value rather than just a number to put in a media kit.
Your analytics dashboard is updated constantly. The question is whether you are reading it the way a brand manager would.