Leveraging YouTube Analytics for Better Monetization Decisions

The Gap Between Views and Revenue
Most creators obsess over view counts. It makes sense on the surface: more views should mean more money. But two channels with identical view counts can have wildly different monthly earnings, and the difference almost always comes down to how well they understand what their analytics are actually telling them.
YouTube's analytics dashboard is not just a scoreboard. It is a decision-making tool. Creators who treat it that way tend to grow faster, earn more per view, and make fewer expensive mistakes, like spending weeks on content that their audience consistently skips halfway through.
This article is for creators who are already on the platform or close to monetization, and who want to move beyond vanity metrics toward the numbers that actually drive revenue.
What YouTube Analytics Actually Measures
YouTube Analytics is the built-in data platform available to every creator through YouTube Studio. It tracks how your videos are found, who watches them, how long they stay, and what actions they take afterward.
The dashboard is organized into several sections:
- Overview gives you a quick snapshot of views, watch time, subscribers, and estimated revenue over a selected time period
- Reach covers how your content surfaces: impressions, click-through rate, and traffic sources
- Engagement tracks watch time, average view duration, and top-performing videos
- Audience shows subscriber demographics, returning versus new viewers, and when your audience is online
- Revenue (available only after monetization) breaks down estimated ad revenue, RPM, CPM, and revenue by video
Each section answers a different question. Reach tells you whether YouTube is showing your content. Engagement tells you whether viewers are staying. Revenue tells you whether the audience you are attracting is commercially valuable.
The Metrics That Connect to Money
Not every metric in the dashboard has a direct line to earnings. Likes and comments matter for the algorithm, but they do not pay you directly. The metrics with the clearest connection to revenue are:
- Watch time and average view duration - Ad revenue is tied to ad impressions, and ads only play when people actually watch. A video with 50,000 views but a 20% average view duration will earn less than one with 30,000 views and 65% retention.
- RPM (Revenue Per Mille) - RPM measures how much you earn per 1,000 video views after YouTube takes its cut. It is the most honest measure of how well your channel monetizes.
- CPM (Cost Per Mille) - This is what advertisers pay per 1,000 ad impressions. Your RPM will always be lower than your CPM because not every view includes an ad, and YouTube keeps 45% of ad revenue.
- Click-through rate (CTR) - This measures how often people click your video after seeing its thumbnail. A higher CTR means YouTube will push the video to more people.
- Impressions - The number of times YouTube showed your thumbnail to users. High impressions with low CTR suggests your thumbnail or title is not compelling enough.
Understanding RPM vs. CPM
This is one of the most misunderstood areas in creator economics. Creators often hear that YouTube pays a certain amount per 1,000 views, but that figure is meaningless without context.
CPM is what advertisers bid to reach your audience. A channel about personal finance or software tools will have a much higher CPM than a channel about gaming or daily vlogs, because financial services and B2B software companies pay more per click than consumer entertainment brands.
The key difference between RPM and CPM is that RPM is based primarily on video views while CPM is based on ad views, and RPM accounts for the 45% cut of revenue that YouTube takes. RPM is what you actually receive after those deductions.
The practical implication: a channel with a high RPM can earn more money with fewer views than a channel with a low RPM. This is why chasing raw view counts without considering audience quality is a flawed strategy.
> A channel earning $8 RPM needs roughly 250,000 views to hit $2,000 in a month. A channel earning $2 RPM needs over 1 million views to reach the same number.
The RPM you can realistically achieve depends heavily on your niche, your audience's location, and the types of ads that run on your content. Finance, legal, insurance, and business content consistently attract higher CPMs. Entertainment, reaction content, and general lifestyle tend to attract lower ones.
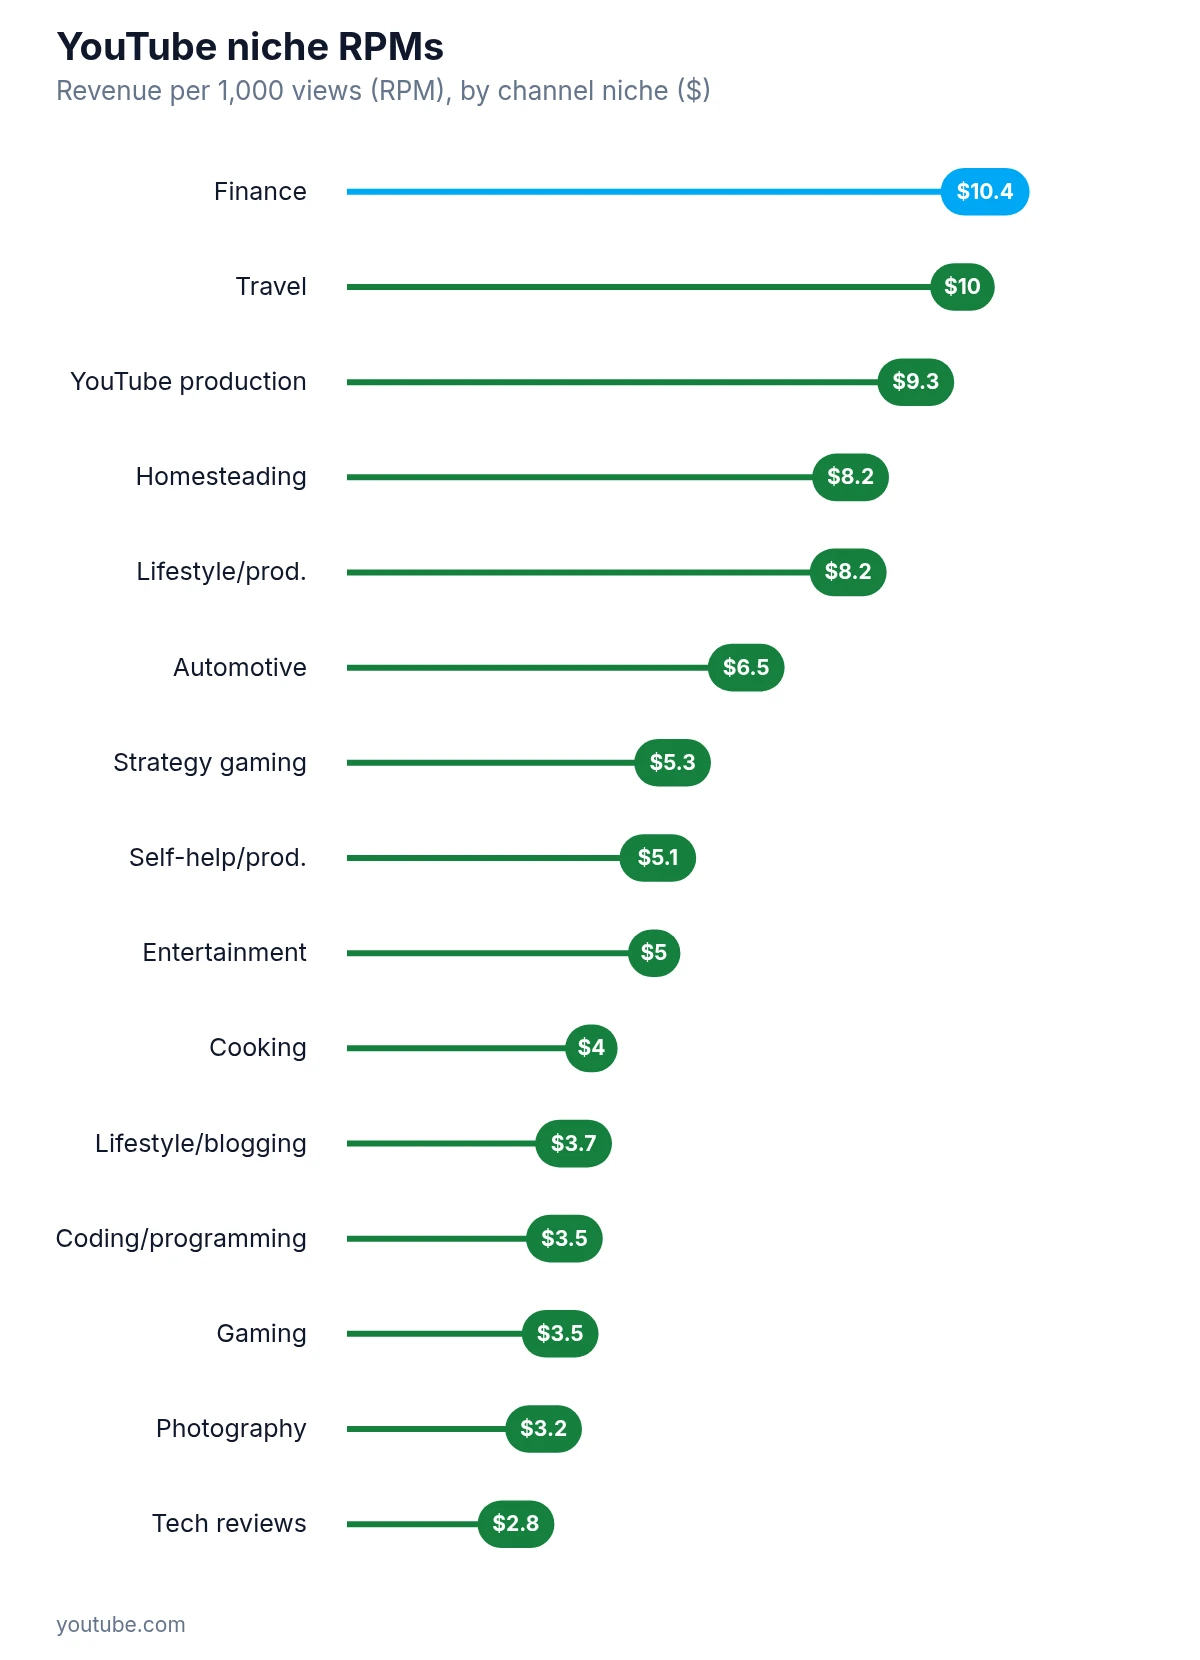
Finance leads the listed niches at $10.39 per 1,000 views, just ahead of travel at $10.02.
Click-Through Rate: What Good Actually Looks Like
CTR measures what percentage of people who see your thumbnail actually click it. YouTube shows you this number in the Reach tab.
A CTR of 7% is genuinely strong. Most established channels with broad audiences see CTRs between 2% and 5%, because as YouTube pushes your content to larger and less targeted audiences, the percentage who click naturally drops. A very high CTR (above 10%) often means YouTube is only showing your video to your most loyal subscribers, which limits total reach.
The relationship between CTR and impressions matters more than CTR alone. A video with 2 million impressions and a 4% CTR is performing better than a video with 10,000 impressions and a 12% CTR. The former has 80,000 clicks; the latter has 1,200.
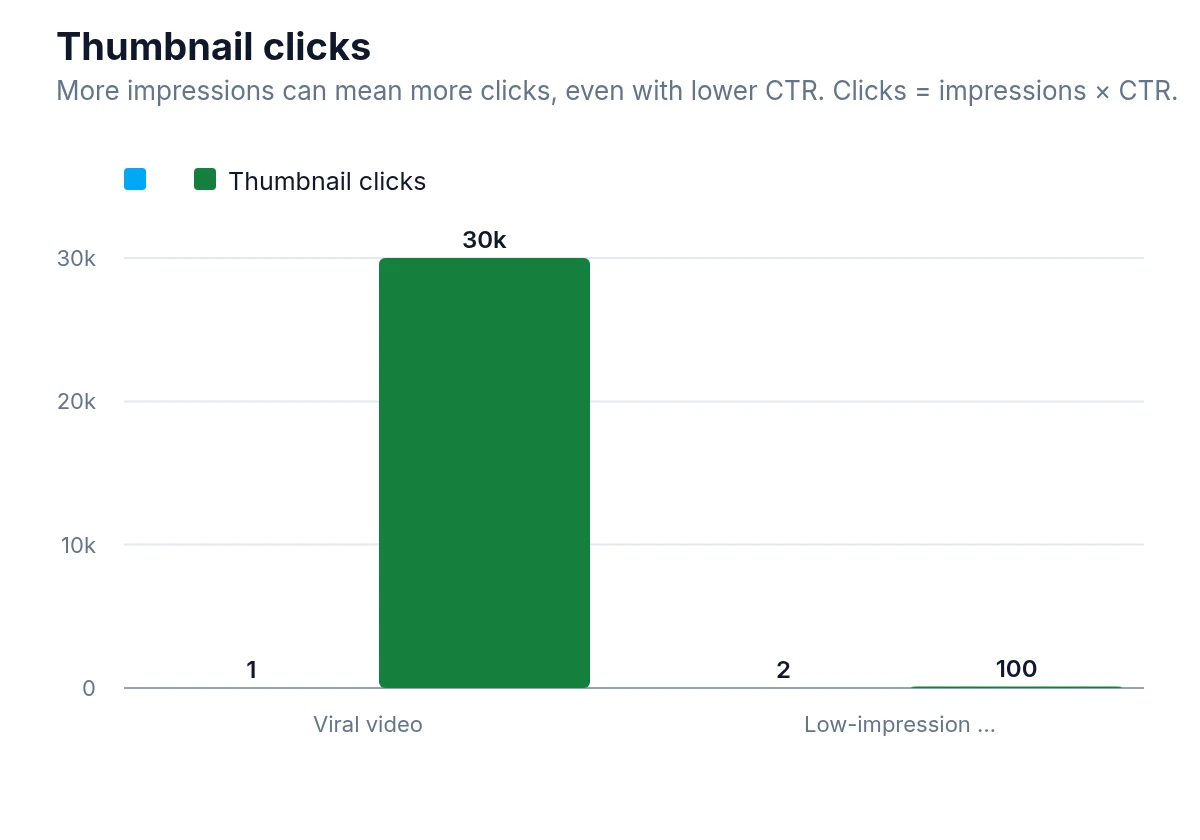
The viral video gets 30,000 thumbnail clicks, compared with 100 for the low-impression video.
When CTR drops on a video over time, that is normal. YouTube tests new thumbnails against different audience segments, and as it reaches beyond your core subscribers, CTR tends to fall. What you want to watch for is whether a new video's CTR is significantly lower than your channel average from the start, which usually points to a weak thumbnail or a title that does not match what people want to click.
Watch Time and Retention: The Metrics Advertisers Care About
Advertisers pay for completed ad views, not just impressions. A viewer who clicks away after five seconds is less valuable than one who watches for eight minutes.
Your audience-retention measures, found under the Engagement tab, can provide valuable information for improving your videos and for better understanding what viewers are actually interested in. Common patterns in the retention graph:
- A steep drop in the first 30 seconds usually means the intro is too slow or the video does not deliver on the promise of the title
- A gradual decline throughout is normal and expected
- Sharp drops at specific moments often correspond to a topic shift, a long sponsor read, or a section that does not match viewer intent
- Spikes (where the graph goes up) indicate a moment viewers rewatched, which is a strong signal of high-value content
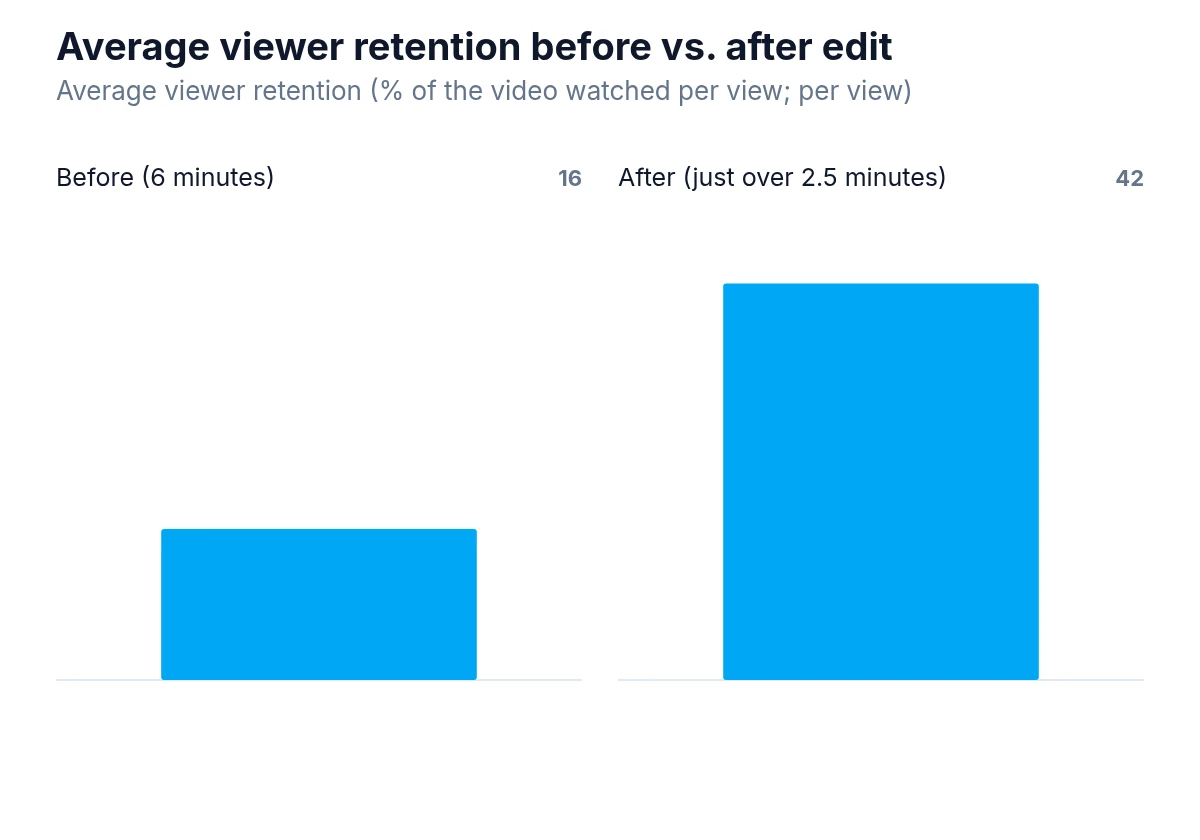
Average viewed rose from 16% before the edit to 42% after it.
For monetization purposes, longer average view durations generally mean more ad slots and higher earnings per view. YouTube can insert mid-roll ads in videos over eight minutes, and creators who use a mix of automatic and manual placements see mid-roll ad revenue that is over 5% higher on average than those using only manually placed slots.
Traffic Sources and What They Tell You About Growth
The Reach tab breaks down where your views come from: YouTube search, suggested videos, browse features (the home page and subscription feed), external sources, and direct or unknown traffic.
This breakdown matters for monetization strategy because different traffic sources behave differently:
- Search traffic tends to be high-intent and evergreen. Viewers searching for a specific answer are often more engaged and more likely to watch fully.
- Browse and suggested traffic is driven by the algorithm recommending your content. This scales well but depends on strong CTR and retention signals.
- External traffic (from social media, blogs, or newsletters) can spike a video early but often has lower watch time than on-platform traffic.
If most of your traffic comes from search, your channel is likely growing steadily but slowly. If browse and suggested traffic is dominant, you are probably in a growth phase where the algorithm is actively pushing your content. Both are healthy, but they suggest different optimization strategies.
The Audience Tab and Why Demographics Affect Revenue
Where your viewers are located has a direct impact on your CPM. Advertisers pay significantly more to reach viewers in the United States, Canada, the United Kingdom, and Australia than in most other countries. This is not a judgment about audience quality; it reflects where the advertising budgets are concentrated.
If your analytics show that a large percentage of your audience is in lower-CPM regions, your RPM will be lower regardless of how well your content performs. Some creators address this by producing content specifically designed to attract viewers in high-CPM markets, though this only makes sense if it aligns with the channel's actual subject matter.
The returning versus new viewer ratio is also worth monitoring. A channel with mostly returning viewers is building a loyal community, which is good for long-term stability and merchandise or membership revenue. A channel with mostly new viewers is growing its reach, which is good for ad revenue growth. Both matter, and the right balance depends on your monetization model.
Using Analytics to Make Actual Decisions
Data is only useful if it changes what you do. Here is how to apply specific analytics findings to specific decisions:
Deciding What to Make Next
Look at your top-performing videos by watch time (not just views). If certain topics consistently generate longer watch times and higher RPMs, that is where your next videos should go. The audience retention graph can also show you which parts of a video viewers rewatched, which often reveals subtopics worth expanding into their own videos.
Fixing Underperforming Videos
If a video has strong impressions but weak CTR, the thumbnail or title is the problem. Test a new thumbnail. If a video has strong CTR but poor retention, the content is not delivering on the promise of the title. That is a scripting or structure issue to fix in future videos.
The relationship between CTR and retention becomes clearer when you compare how strong early clicks can lead to different outcomes.
Timing Uploads
The Audience tab includes a viewer activity heatmap that shows when your subscribers are most active on YouTube. Publishing a few hours before your peak activity window gives the algorithm time to start distributing your video before your audience is most likely to be browsing.
Evaluating Sponsorship Rates
If you work with brand sponsors, your RPM and CPM data gives you a benchmark for what your audience is worth to advertisers. A channel with a high CPM can justify higher sponsorship rates because the audience has demonstrated commercial value.
The Path to Monetization and What Comes After
To join the YouTube Partner Program, a channel needs 1,000 subscribers and 4,000 watch hours in the past 12 months (or 1,000 subscribers and 10 million Shorts views, under the Shorts-specific threshold). These are the minimum requirements, not targets to optimize for directly.
The more useful question is not "how do I hit the threshold?" but "am I building a channel that will earn meaningfully once I am monetized?" A channel that hits 1,000 subscribers with 4,000 watch hours from low-retention, low-CPM content will earn very little from ads. A channel that hits those numbers with strong retention and a high-value niche will earn much more from the same traffic.
After monetization, the Revenue tab becomes your most important tool. Track RPM over time. If it drops, check whether your content mix has shifted toward lower-CPM topics, or whether your audience demographics have changed. If it rises, identify what changed and do more of it.
Realistic Expectations for Ad Revenue
There is no single answer to how much YouTube pays per 1,000 views because the range is genuinely wide. A gaming channel might earn $1 to $3 RPM. A personal finance channel might earn $8 to $15. A channel targeting small business owners or software buyers could earn even more.
The time it takes to reach meaningful income varies just as much. Channels in competitive niches with strong retention and high-CPM audiences can reach $1,000 to $2,000 per month in ad revenue with relatively modest view counts. Channels in low-CPM niches might need ten times the views to earn the same amount.
What analytics gives you is the ability to see where you are on that spectrum and make deliberate choices about where to go. A creator who checks their RPM, retention, and traffic sources monthly and adjusts their content strategy accordingly will almost always outperform one who posts consistently but never looks at the data.
Making the Data Work for You
YouTube Analytics is not complicated, but it does require consistent attention. The creators who get the most out of it are not necessarily the ones who understand every metric in depth. They are the ones who check the data regularly, ask specific questions about what they see, and make one or two adjustments at a time rather than overhauling everything at once.
Start with RPM and retention. Those two metrics will tell you more about the health of your monetization than anything else. From there, work outward: look at what drives your best-performing videos, where your traffic comes from, and who your audience is. Each answer points toward a clearer content strategy, and a clearer content strategy is what turns a YouTube channel from a hobby into a business.